
One of the unique things about working as a small team at Fora Health is that there isn’t much standing in our way between an exciting new technology and integrating it as part of our product. Some time last year, James pointed me to exactly one of these things: Observable, of D3 and Plot fame, had just released a technology preview of Observable Notebook Kit.
Amongst many new improvements to the authoring experience was the ability to also build notebooks into static sites using Vite. James had a hunch that this could be a great way to finally start using Observable’s incredible datavis capabilities within our web app, and I was more than happy to give it a go.
Some Background on Fora Health
Fora Health is a suite of applications for optimising patient health and clinical efficiency by enabling shared decision-making practices. Our core product consists of a mobile app that patients use for regular health tracking, and a web app that care teams use to monitor patient health within their existing workflows.
We work with a variety of healthcare providers, and oftentimes in research contexts. This meant that one of our requirements was not only to collect health data for clinicians, but to also collect activity and engagement data so that researchers can characterise how patients are using the app, and how this relates to their health outcomes.
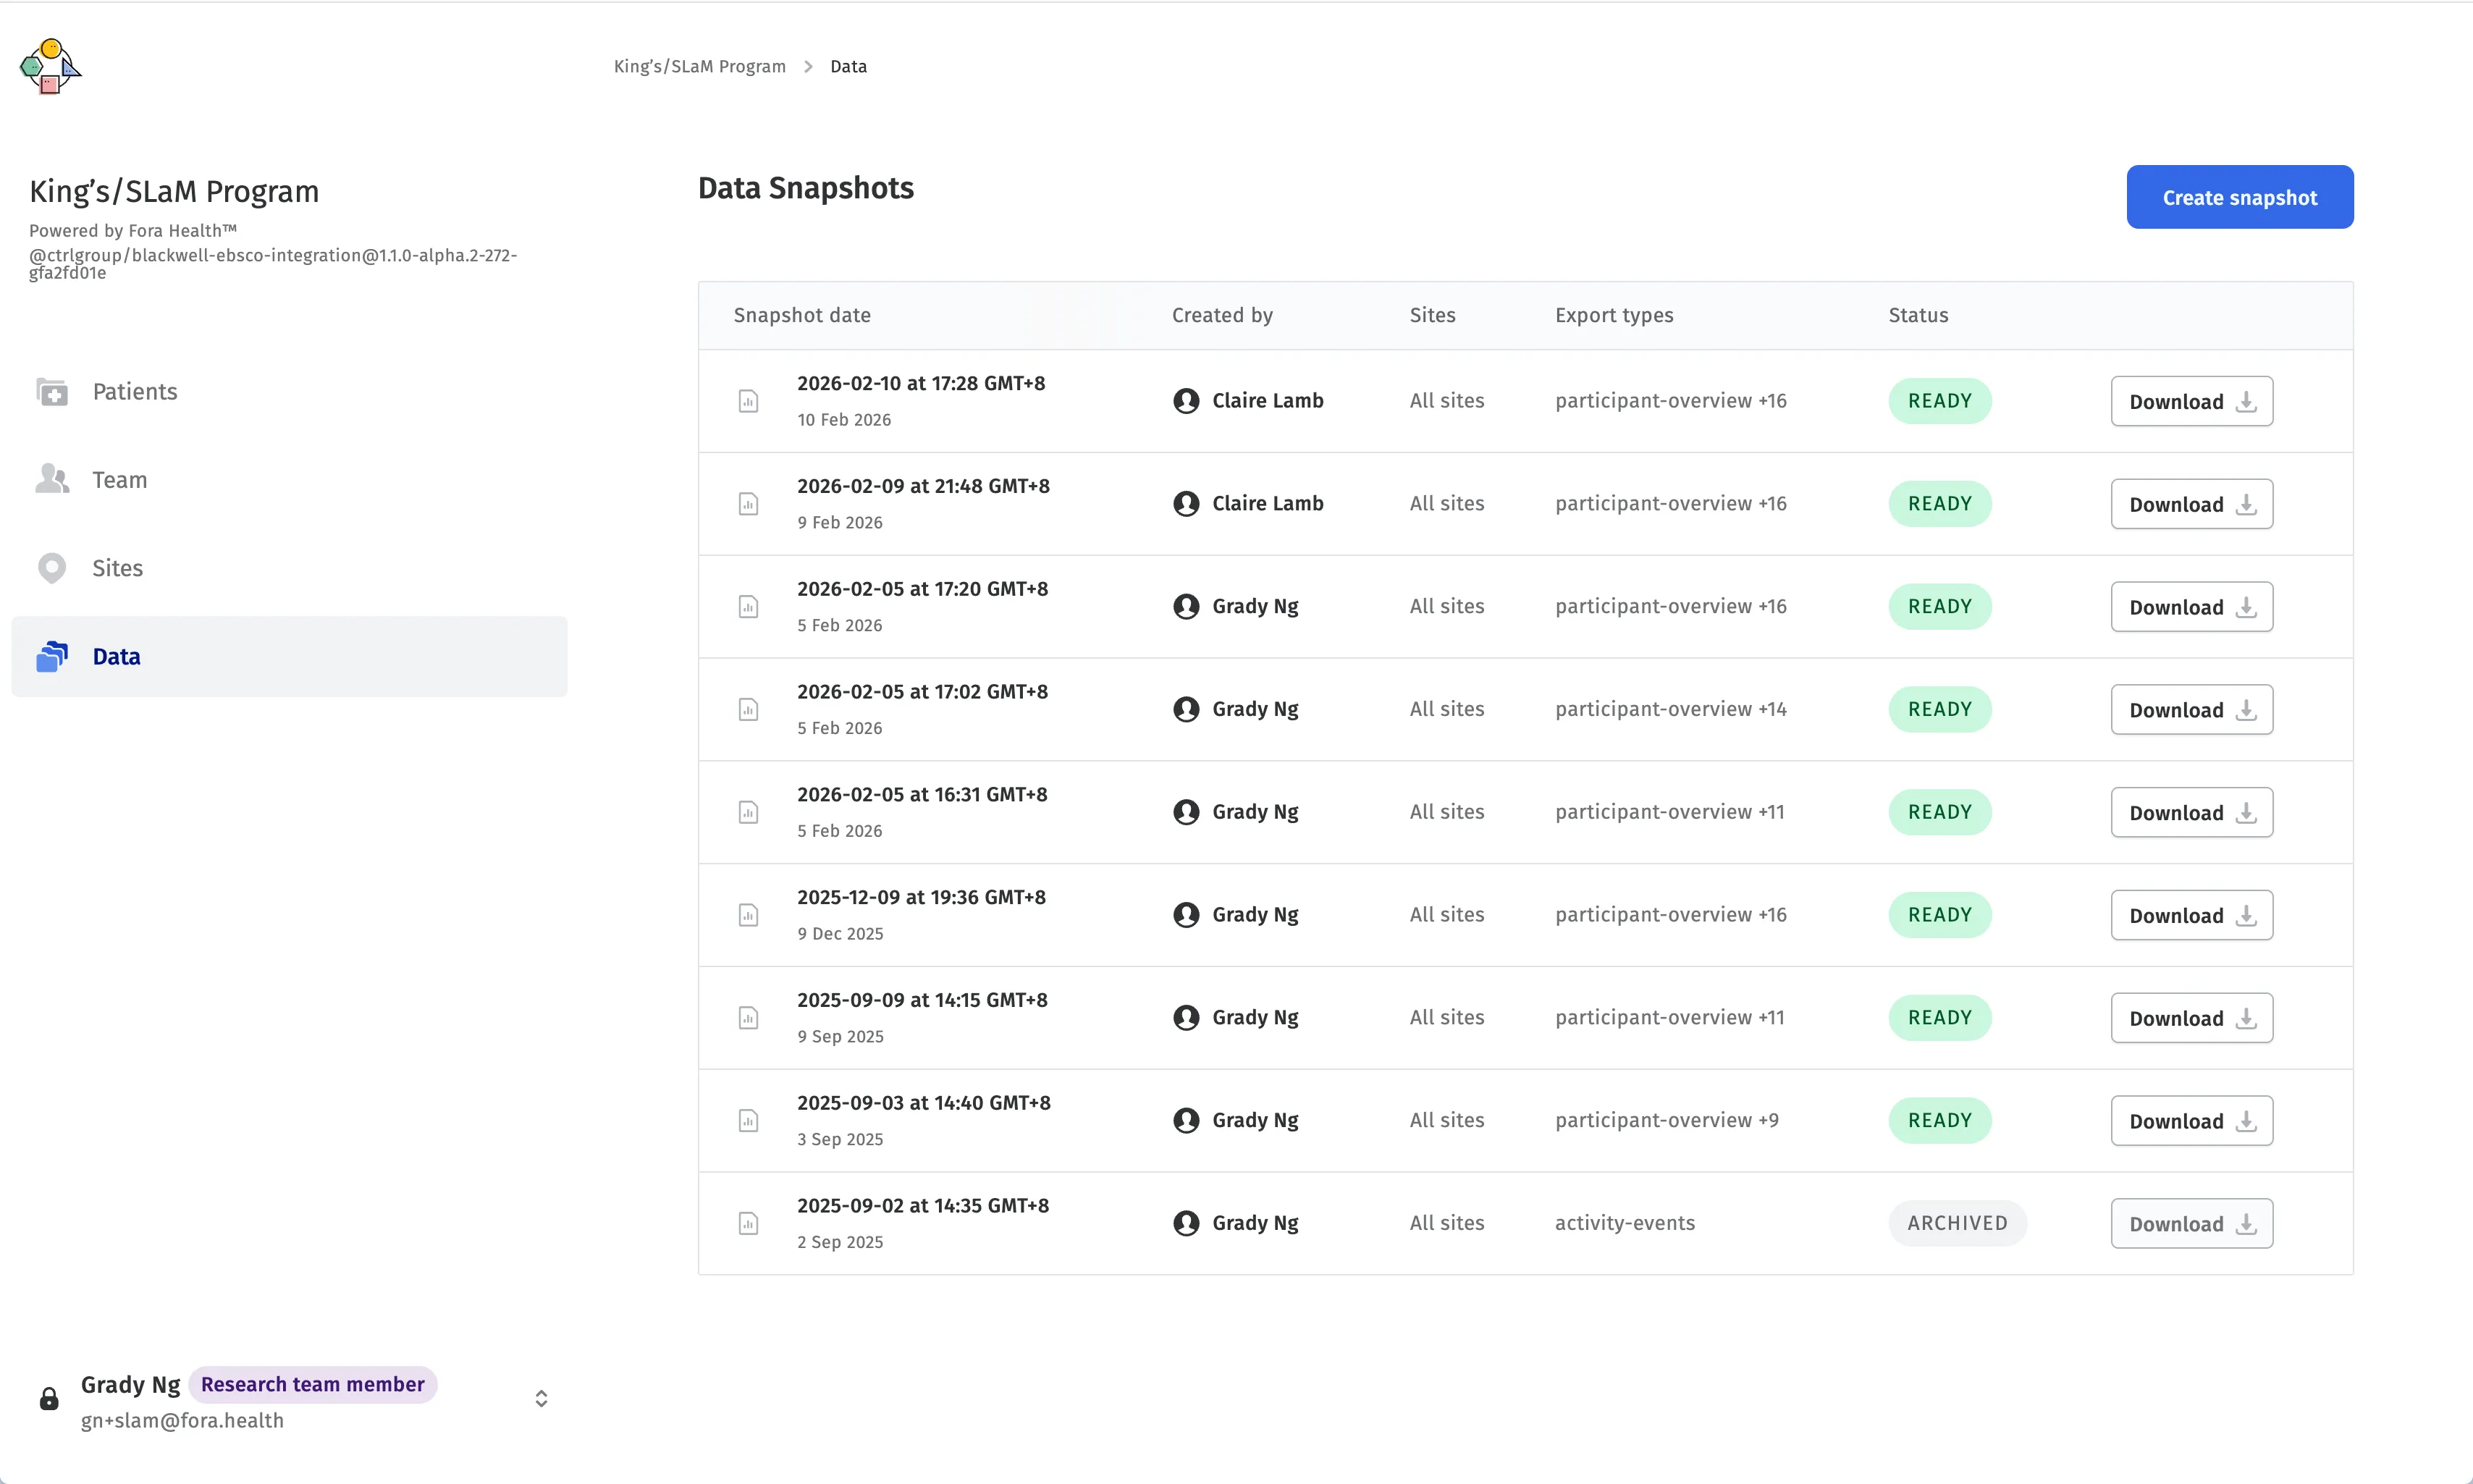
In our existing product, we had built a basic dashboard that allowed researchers to generate data snapshots of patient activity within a range of dates, downloading them as a set of CSV files that could be further processed as needed. While this fulfilled the need for data access, our internal user research and external collaborations hinted at a want for more interactive data visualisations that could give a first impression of the underlying data.
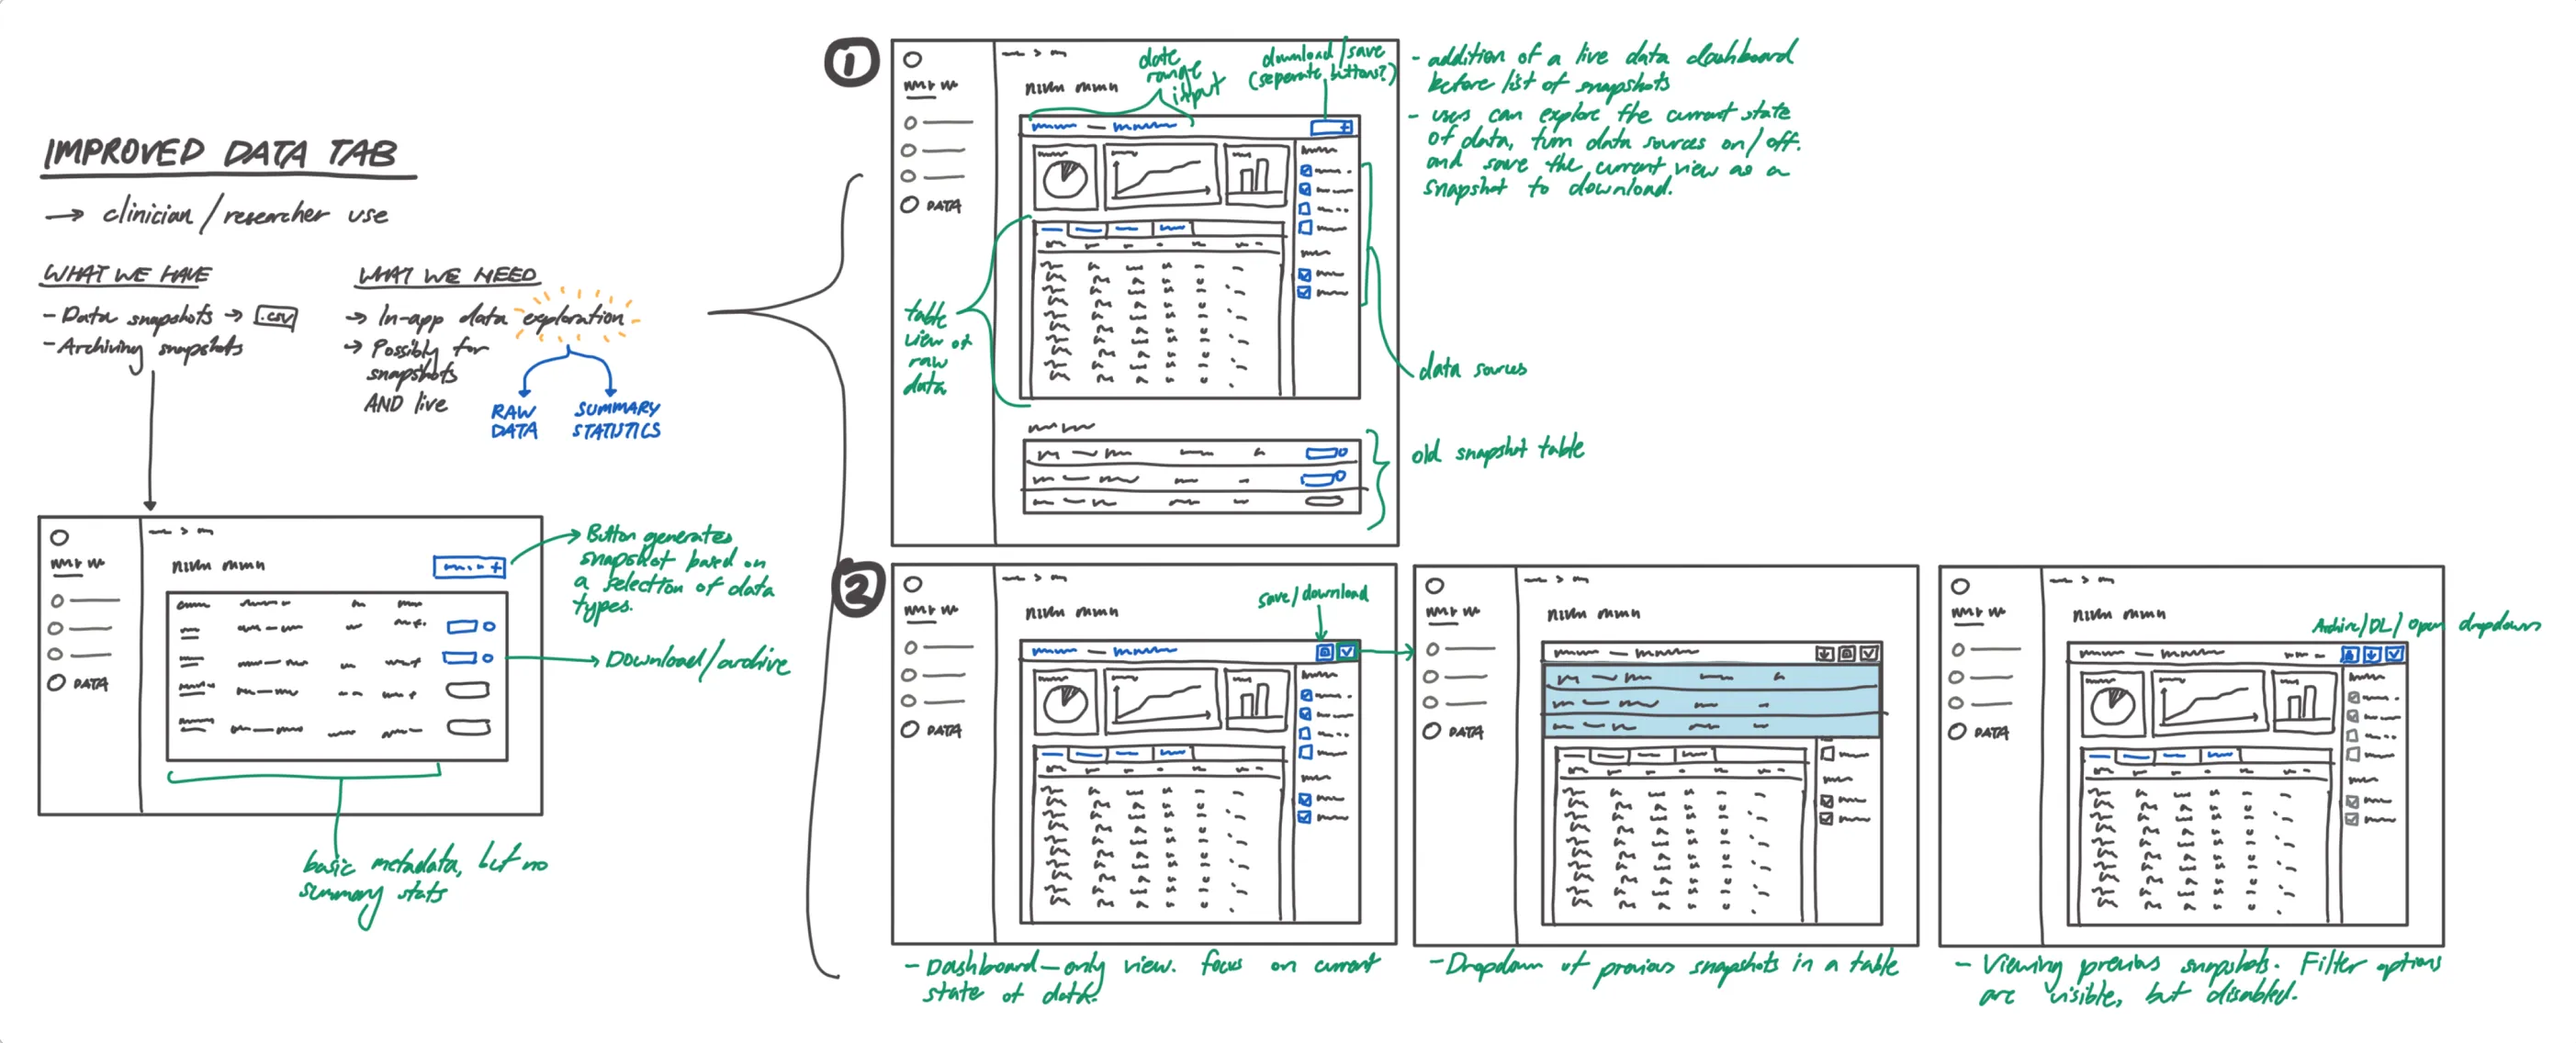
This was where Observable Notebooks came in. Our backend was already returning engagement data in a tidy format ripe for visualisation using Plot or D3, and Notebook Kit was the final piece of the puzzle that could help us build interactive charts that were easy to maintain. In addition, the notebook format was highly customizable, and we could easily swap them in and out depending on what our organizational partners needed.
There were a few things to consider for our technical approach, though. Notebook Kit was built on top of Vite, and while it was primarily a command-line interface that built static sites from notebooks, it also came as a Vite plugin that offered deeper, lower-level integration with existing Vite apps, which our web app was.
It was tempting to try and use this plugin to build notebooks directly into our web app, but after some experimentation, some challenges arose. Notebook Kit’s Vite plugin was still in early days, and there wasn’t much documentation nor examples around using it. It was also built on Vite 7, while our web app was lagging behind. While it was possible to upgrade our web app toolchain, this would have been a significant undertaking that would have delayed what was meant to be a quick proof-of-concept.
In the spirit of rapid prototyping, it made the most sense for us to adopt a micro frontend approach to this data visualiser. Our web app codebase was already set up as a monorepo to handle different concerns and flavours of the app, so it was fairly straightforward to add a new package for the data explorer, built entirely from Notebook Kit’s CLI.
Setting up the Notebook Kit micro frontend
blackwell-web/
├── packages/
└── blackwell-web-app/
└── ...
└── blackwell-data-explorer/
├── package.json
├── ...
└── notebooks/
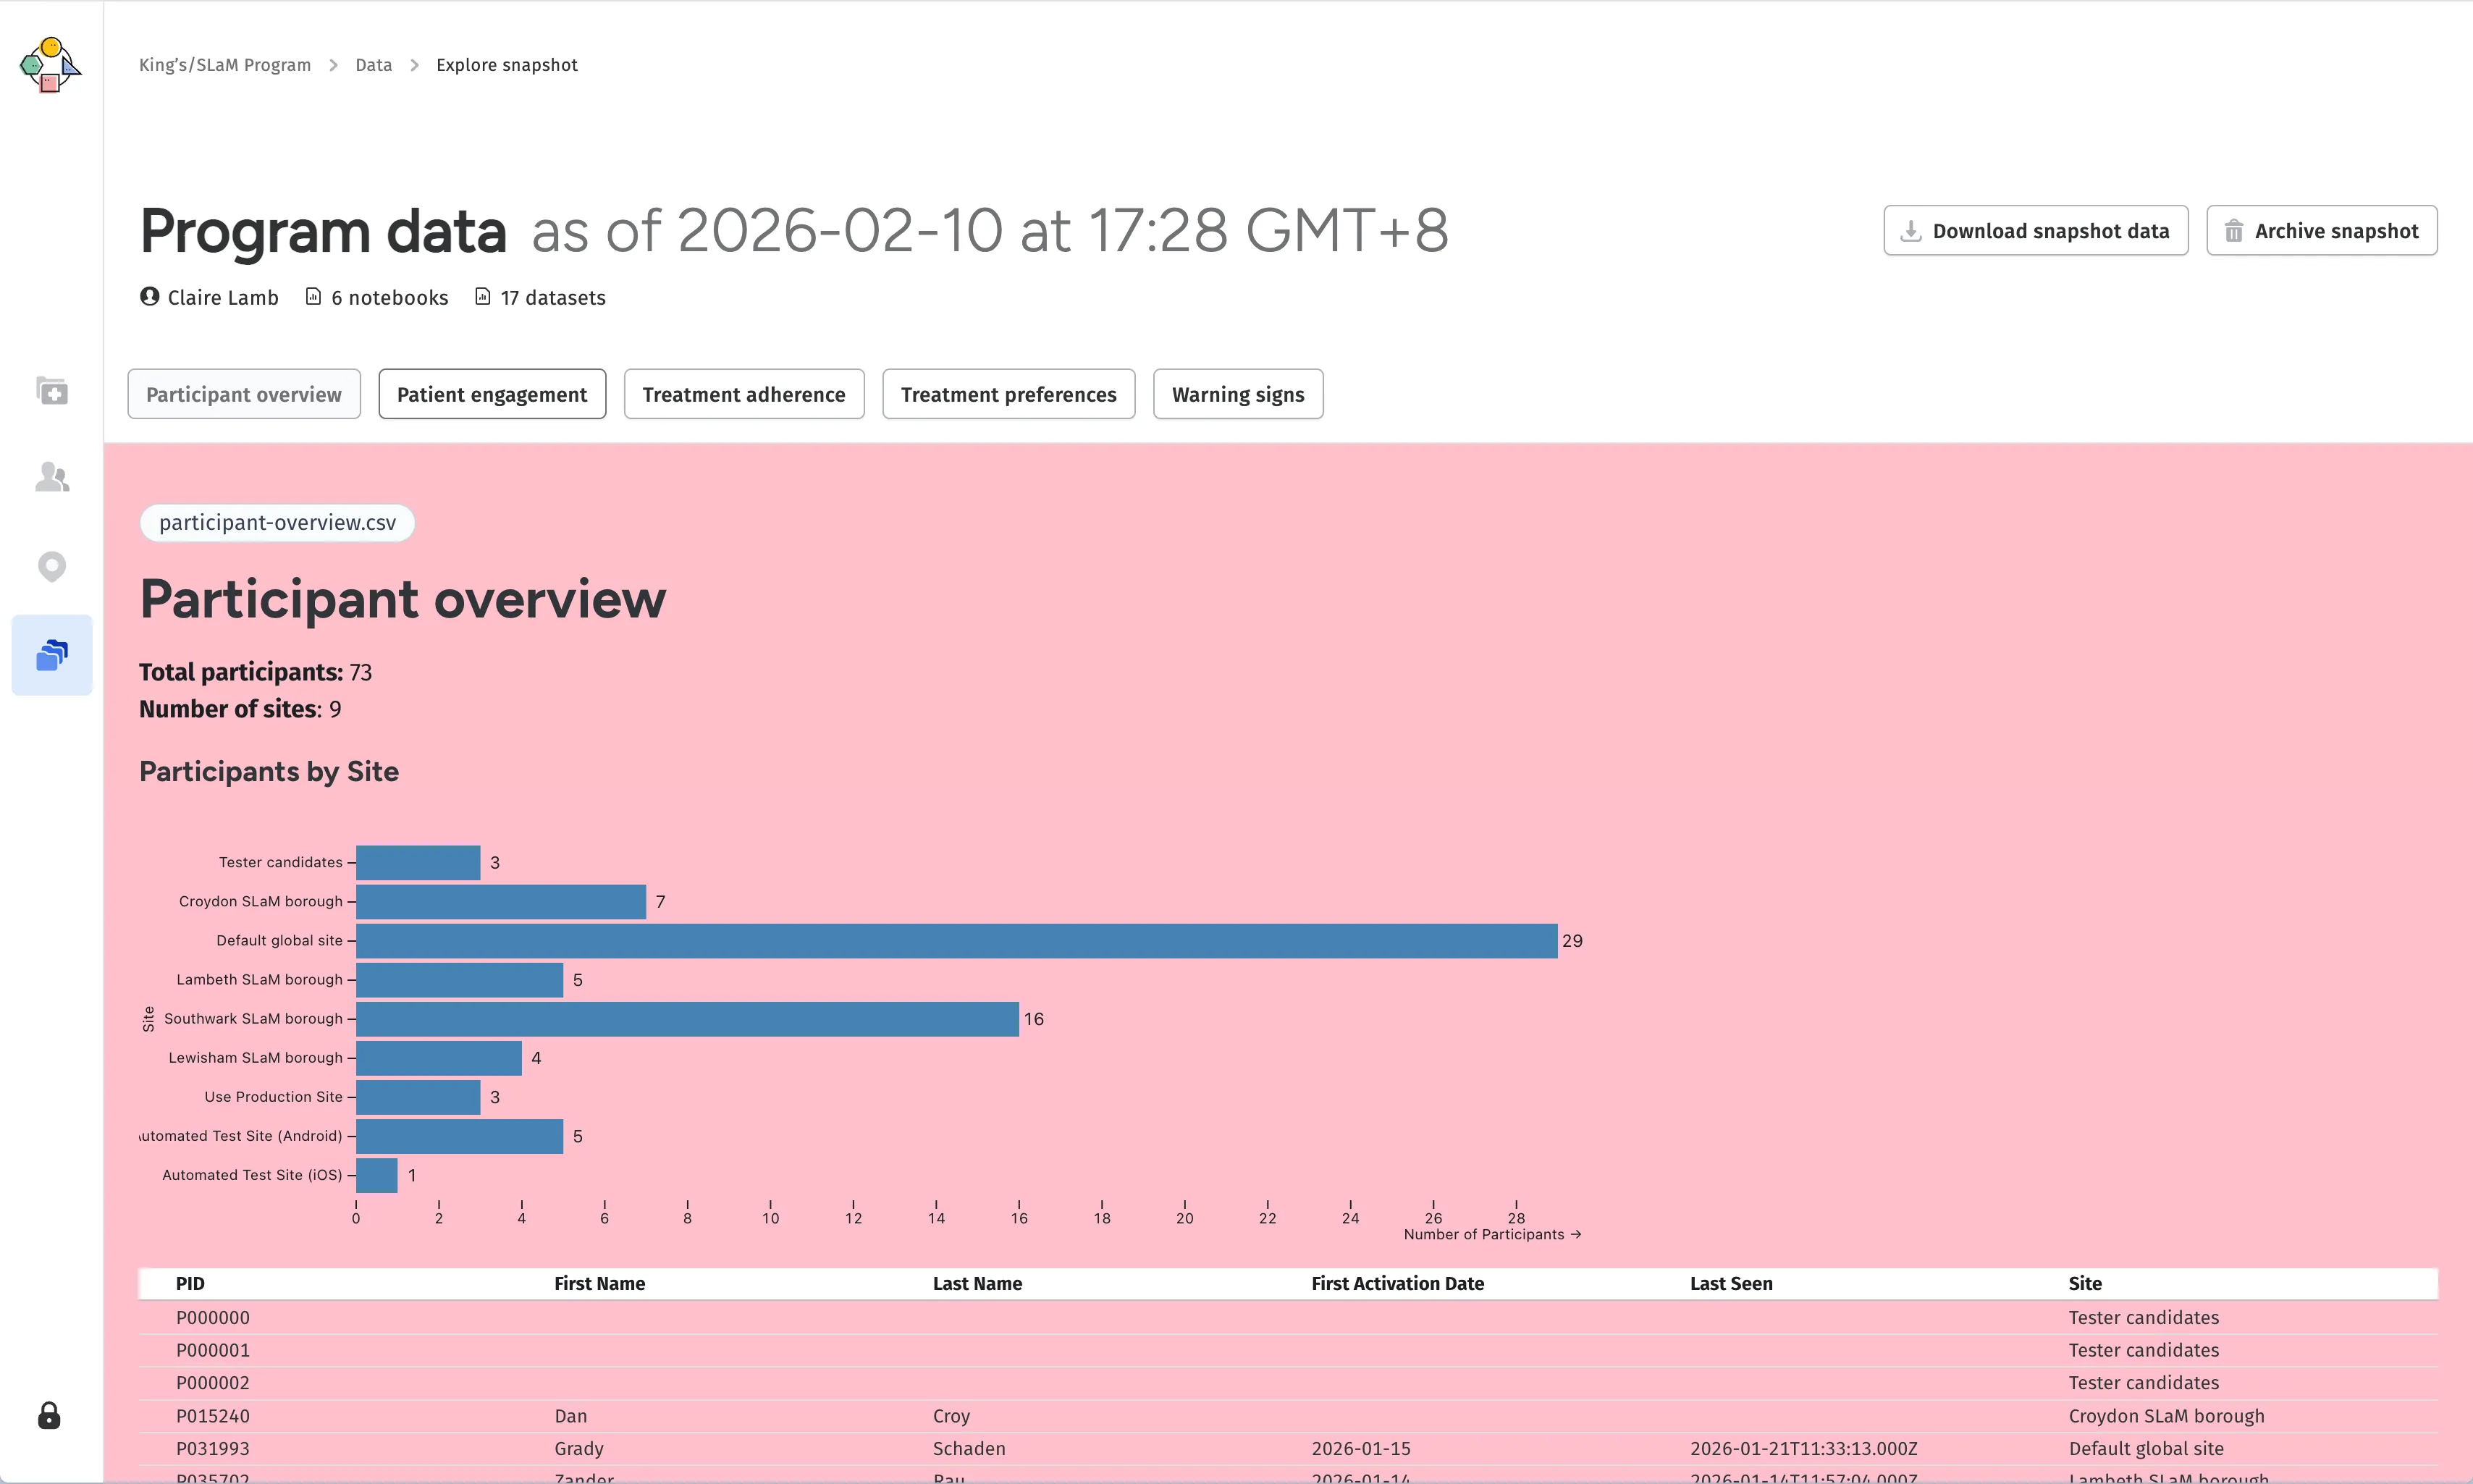
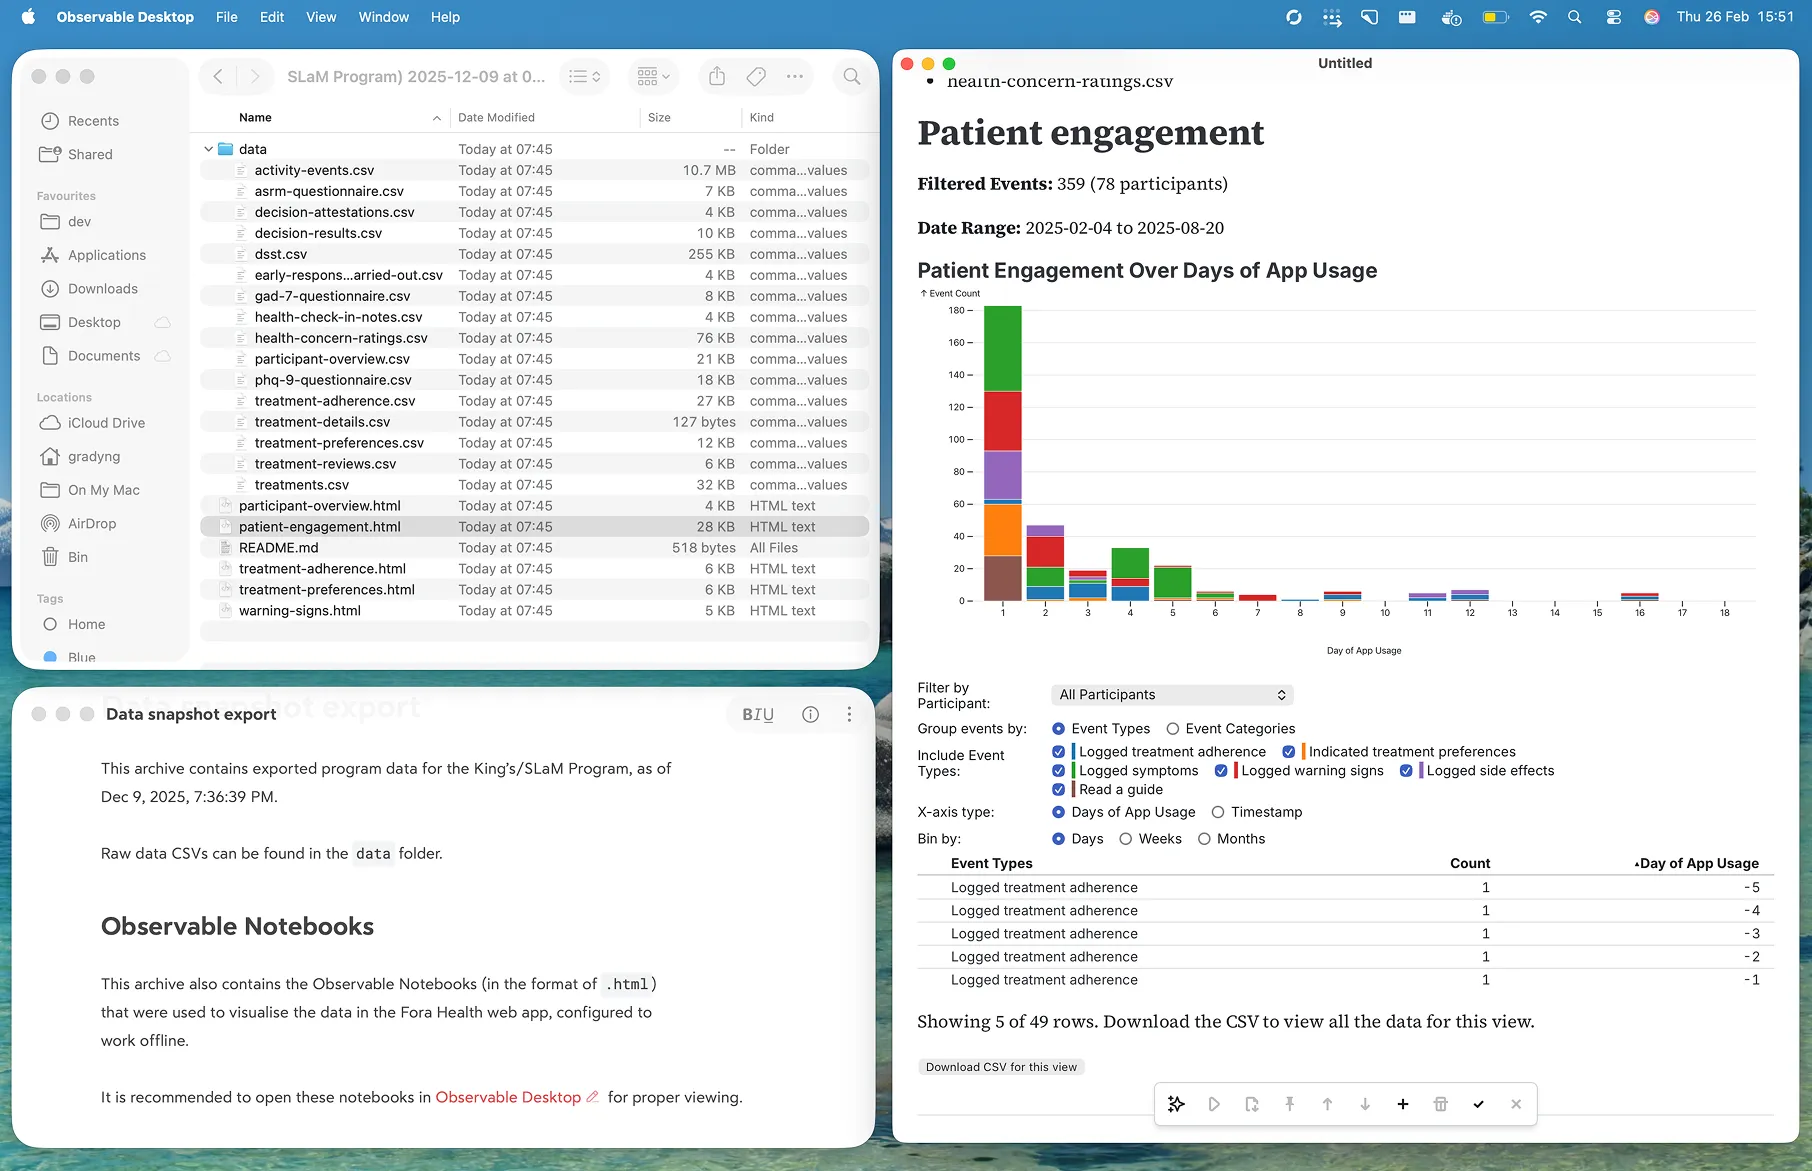
├── participants-overview.html
└── patient-engagement.htmlSetting up the new project itself was pretty simple - all we needed to do was point Notebook Kit to the notebooks directory, and it would take care of building the static site for us. We then set up a simple iframe-based integration within our web app to load the built notebooks as needed.
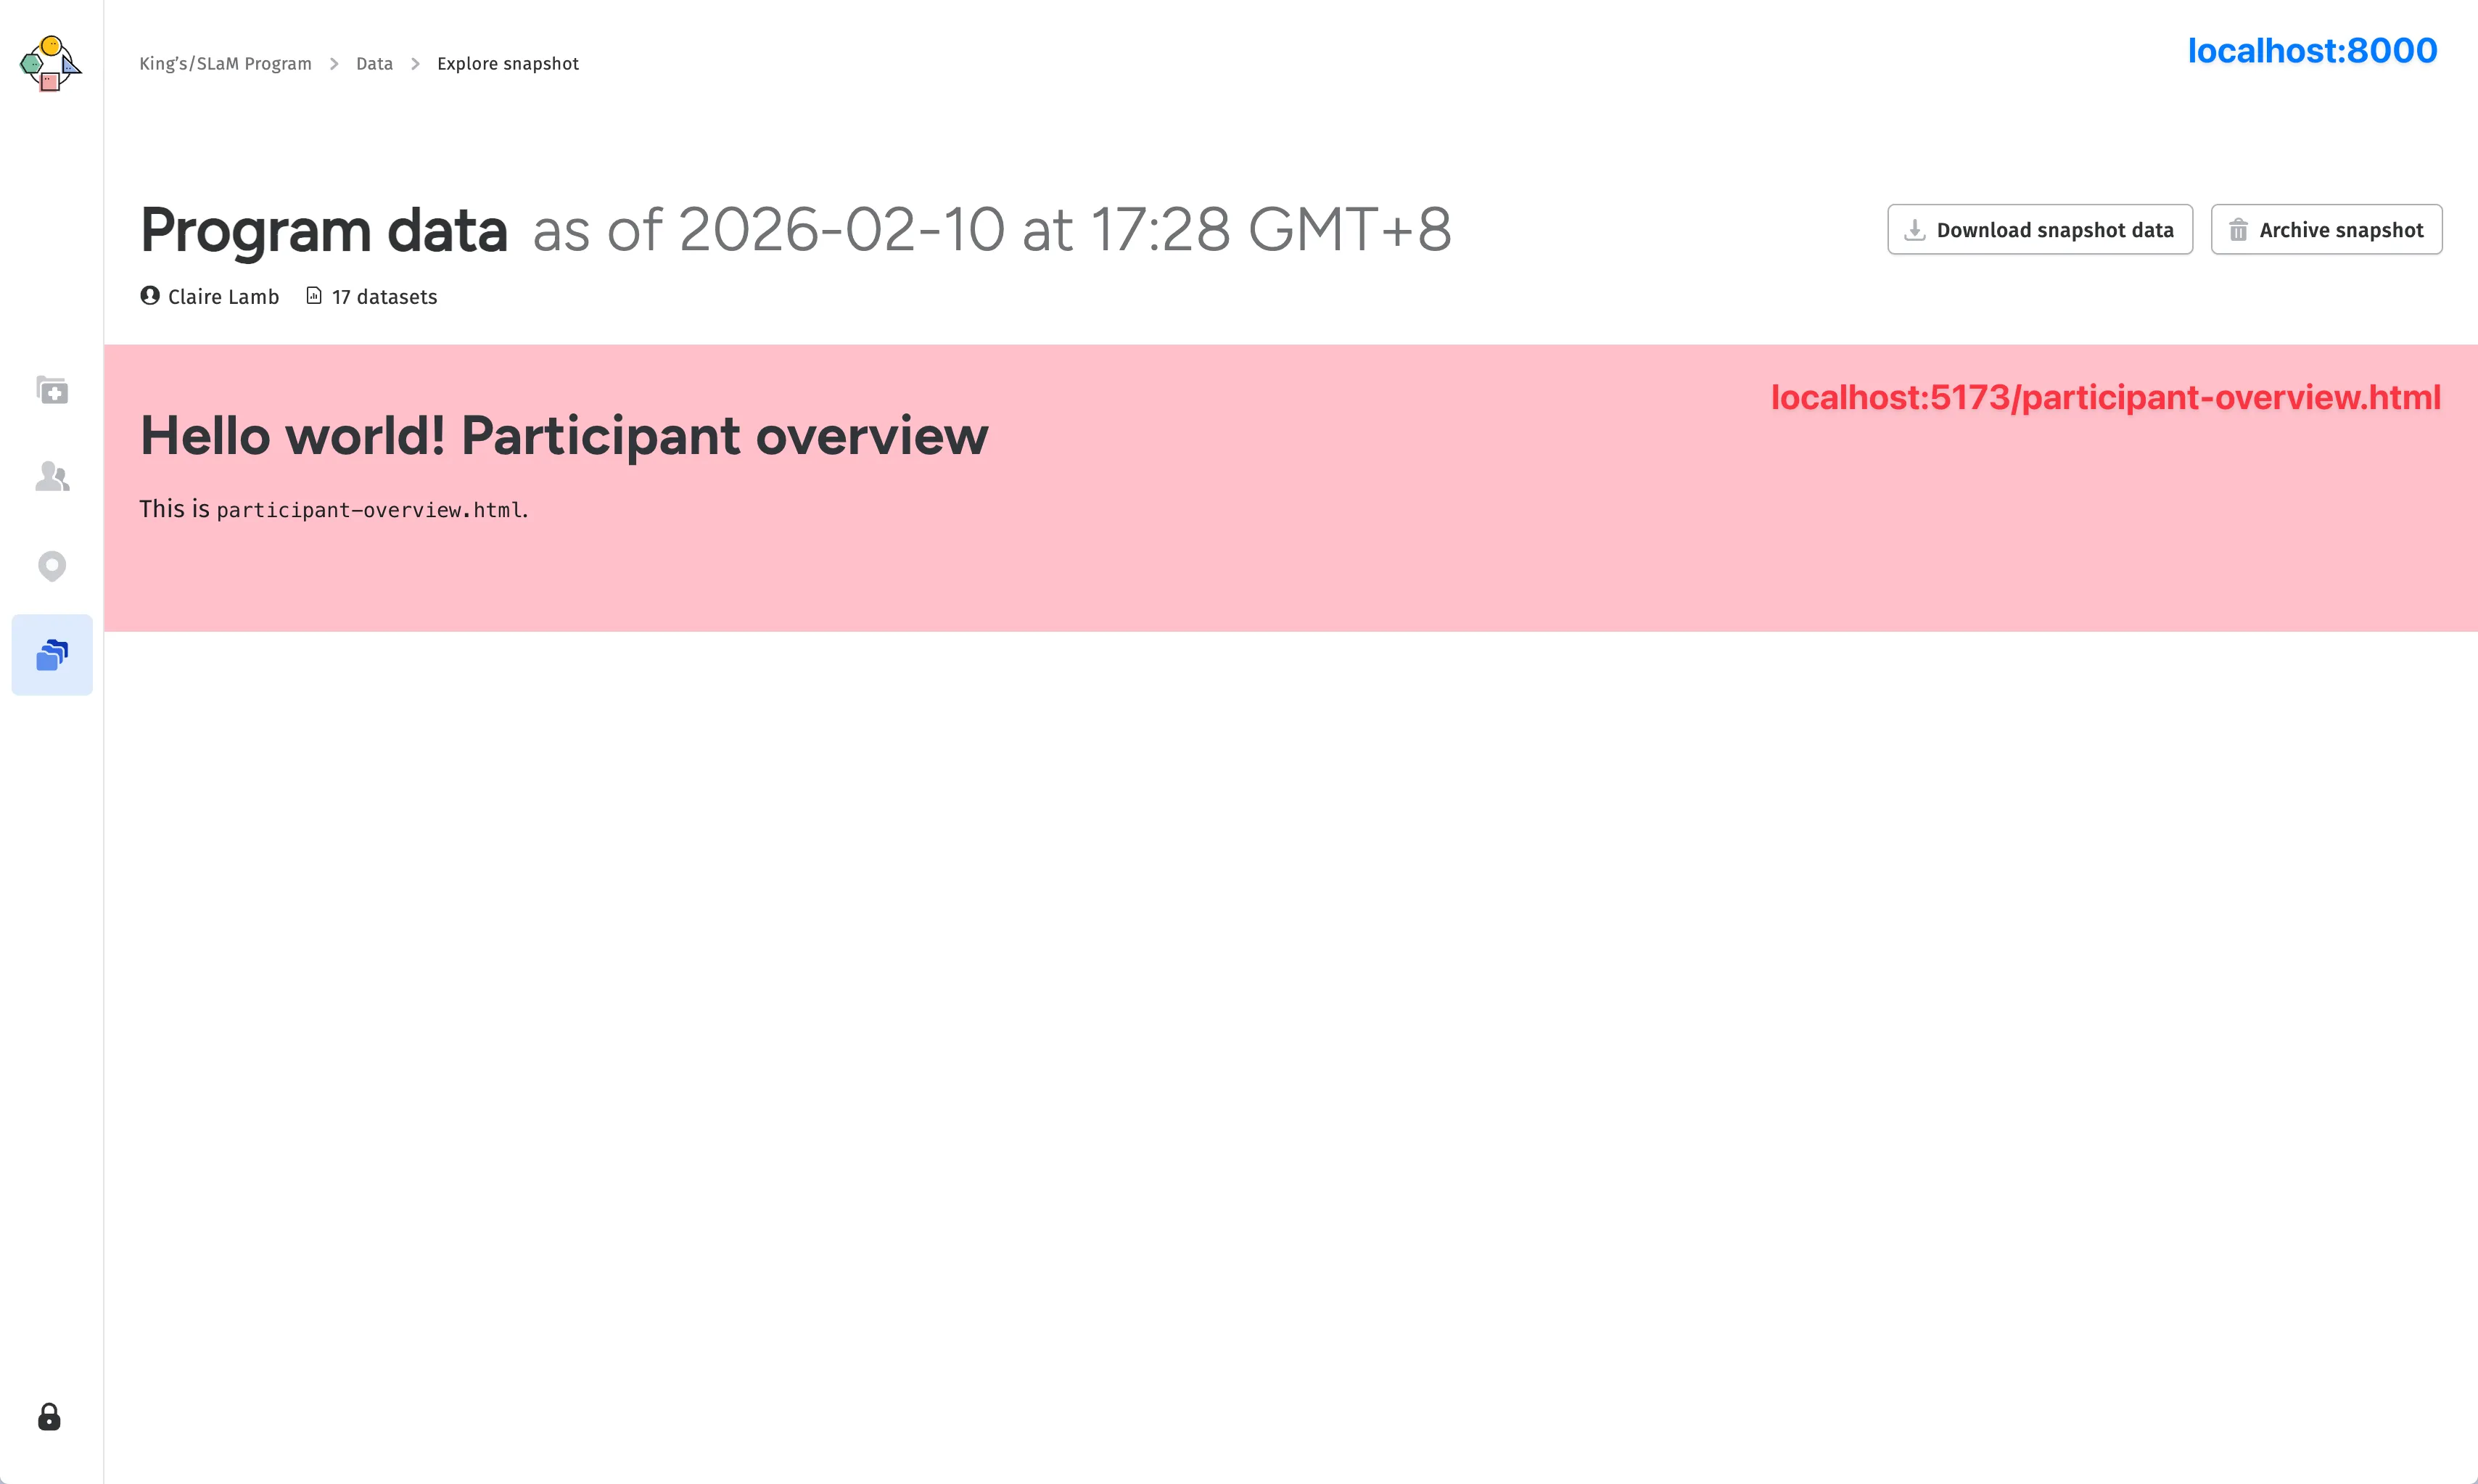
Now that we had the basic architecture in place, we moved on to the issue of data loading. We wanted the notebooks to be able to visualise real patient data from the data snapshot, but since the notebooks were built as a separate static site, they didn’t have access to the anything in the parent web app, including the data snapshot that the user selected. There’s no use rendering the data explorer at a route like app.fora.health/data/123 if the iframe can’t actually load the data for snapshot 123.
Ordinarily, Observable notebooks would load data using the FileAttachment API, which would bundle any data with the notebook (and built site) itself. This wasn’t possible for our use case, since the data was dynamic and user-selected, and we certainly didn’t want to be bundling patient data with our static site.
Instead, we had look around for other solutions. Observable has a handy guide on the more traditional ways of loading data from external APIs, which seemed like good solution on the surface. However, these data loaders would only run at build time, which meant that we would have to rebuild the static site every time the user navigated between snapshots, which was not ideal.
Conversely, database connectors felt over-engineered and redundant for our use case – we already had a backend API that delivered serialised JSON data for downloading, and we didn’t want to have to maintain a separate database connection just for the notebooks.
Another idea came out of the fact that this new iteration of Observable Notebooks was at its core, HTML-based. That meant that we had access to vanilla JavaScript, and could simply fetch the data from the our backend within a block.
<script id="DATA_LOADER" type="module" hidden="">
  const backendURL = 'https://data.fora.health/data-snapshot/123';
  fetch(backendURL)
  .then(response => {
    // load the data into the notebook's state
  })
</script>
Even this still felt a bit too much for what was supposed to be a lightweight front-end for visualizing CSV data, and there were questions about how to actually implement this logic:
- Fora Health was a highly flexible platform that relied heavily on user-specific configurations, so different users on the web app could theoretically have access to different datasets and notebooks. How would
blackwell-data-explorerknow which backend URL to fetch from, and how would it know which notebook(s) to load? - How would we handle authentication for these requests, since the notebooks were built as a separate static site and didn’t have access to the parent web app’s authentication state?
We could pass this information like backend URLs and authentication tokens down to the iframe using query parameters, which would let us control the state of the data explorer from its parent. But working down this path led to an even better solution, with a key idea:
If the parent web app can pass down information about the data to the micro front-end, why don’t we just pass the data itself?
This was core realisation that led us to our actual solution, which was to use the postMessage API to send the data snapshot CSVs directly from the parent web app to the notebook. This meant that blackwell-data-explorer didn’t need to directly interface with our backend, be it for data, authentication, or reading user configs. It would simply wait for data from the parent web app, and load whatever it received into the notebook for visualisation.
Easier said than done
As simple as this solution was, it still required quite a bit of code to get running perfectly. Our first step was to set up the postMessage APIs on both the parent web app and the notebook, to send and receive messages containing the data snapshot CSVs. Quite a few things had to happen in the right order for this to work smoothly, from loading the dependencies required by the notebook, requesting the data from the parent web app, fetching and preparing the data and converting it to a format that could be sent through postMessage, and finally loading the data into the notebook’s state for visualisation.
sequenceDiagram
    participant Backend as Backend API
    participant WebApp as Web App
    participant Iframe as Observable Notebook

    Note over WebApp,Iframe: 1. Initialization
    WebApp->>WebApp: Start listening for messages
    WebApp->>Iframe: Load notebook iframe
    activate Iframe
    Iframe->>Iframe: Load dependencies (d3, Plot, etc.)

    Note over Iframe,WebApp: 2. Requesting Data
    Iframe->>WebApp: postMessage({type: "NOTEBOOK_READY"})
    Iframe->>WebApp: postMessage({type: "REQUEST_DATA"})

    Note over Backend,WebApp: 3. Fetching and Preparing Data
    WebApp->>Backend: Request snapshot data
    activate Backend
    Backend->>WebApp: Snapshot data JSON
    deactivate Backend
    WebApp->>WebApp: Convert JSON to CSV
    WebApp->>WebApp: Zip CSV files into a Blob

    Note over WebApp,Iframe: 4. Transferring Data
    WebApp->>Iframe: postMessage({type: "DATA_SNAPSHOT", data: zipBlob})
    Iframe->>Iframe: Process and extract CSV files from Blob
    Iframe->>Iframe: Load data into notebook state

    Note over WebApp,Iframe: 5. Completion Phase
    Iframe->>WebApp: postMessage({type: "NOTEBOOK_LOADED"})
This was a pretty robust solution that allowed us to keep the notebook micro frontend completely decoupled from the backend, with no repeated code for fetching or preparing data on the notebook side. It also allowed us to reuse most of the code that was already in place to fetch and prepare the data as CSVs; we had existing functionality to convert and zip the data from more than a dozen API calls into a single archive, which was sent directly to the notebook as a Blob, where it would be unzipped into CSVs which worked perfectly within the Observable framework.
On the Notebook Kit side, all this data logic was extracted into a data-loader.js script, which every notebook would import and run at the top of the notebook to retrieve the snapshot data and load it into the notebook’s state.
<!-- patient-engagement.html -->

<script id="DATA_LOADER" type="module" hidden="">
  const { DataLoader } = await import(await FileAttachment("data-loader.js").url());
  const loader = new DataLoader();
  const data = await loader.loadData(...);
</script>
Writing the Notebooks
Now that we had a way to load data into the notebooks, we could start writing them. This was the fun part, and the whole reason we wanted to do this in the first place. We had a lot of freedom in how we wanted to visualise the data, and the notebook format made it easy to iterate on different ideas and approaches.
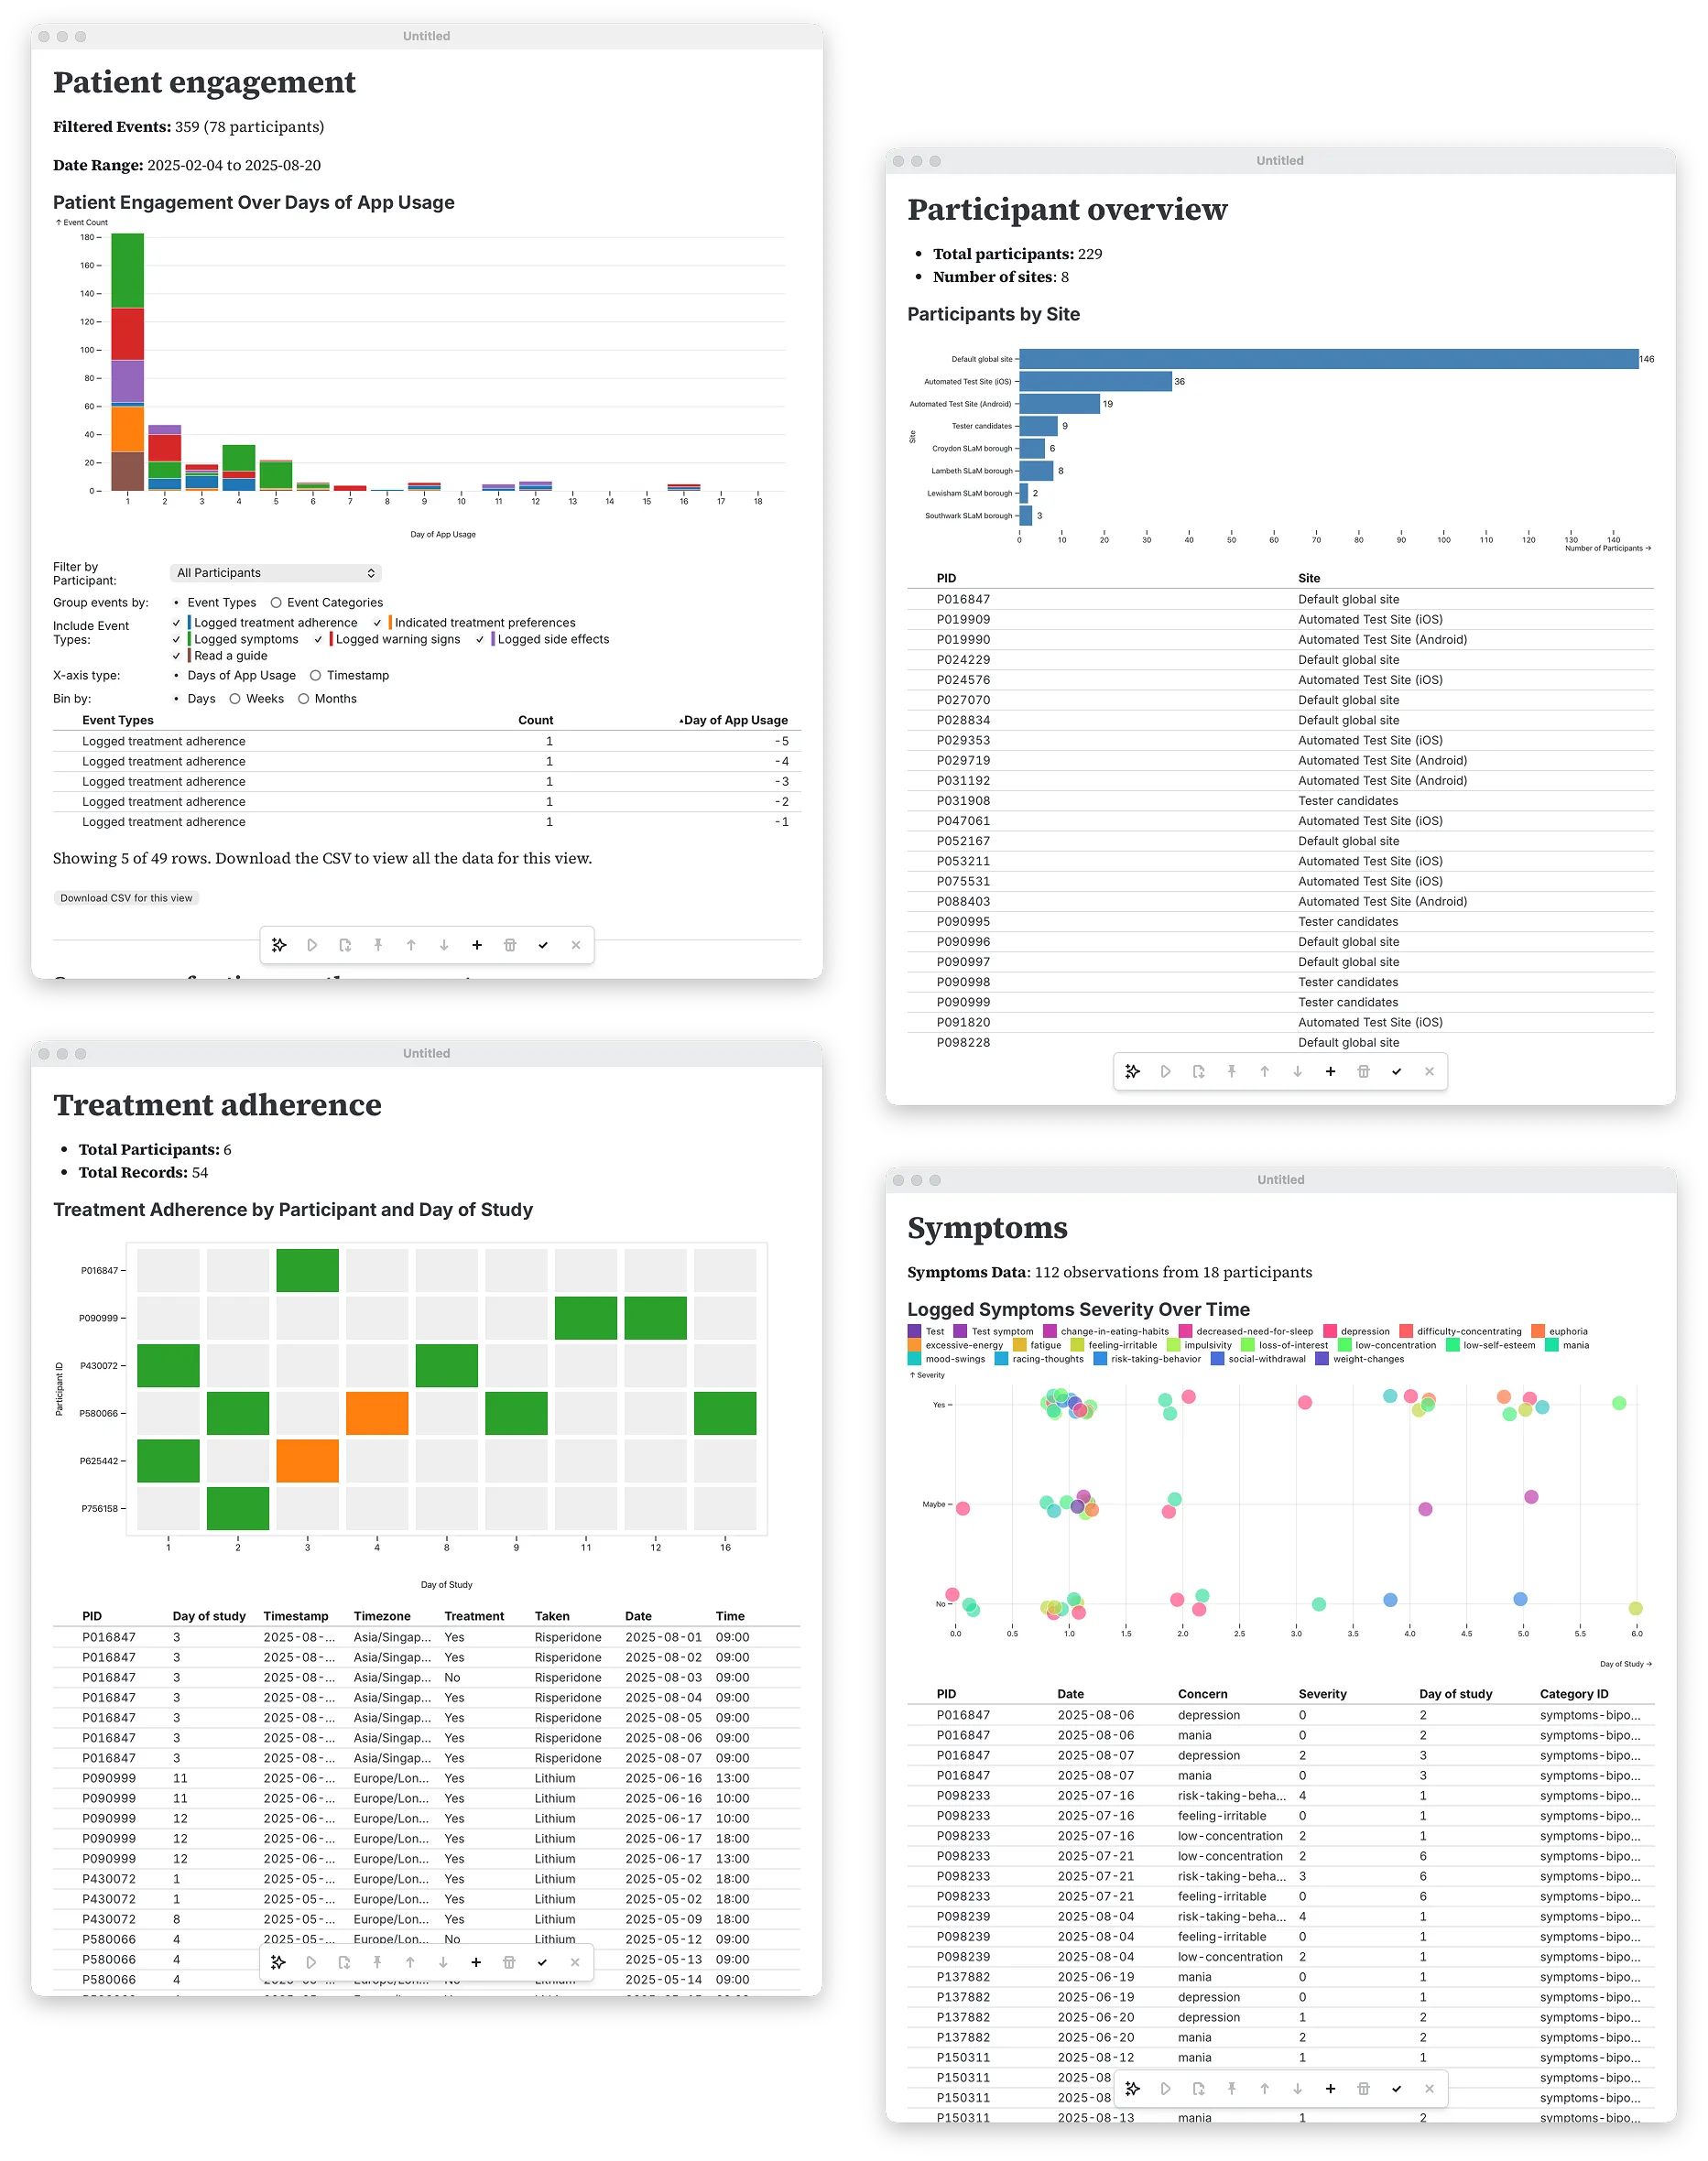
To handle multiple notebooks, we initially tried a navigation block in the boilerplate of every notebook (similar to the data loading logic), which would link to other notebooks in the notebooks directory. This didn’t quite hit the mark for what we needed, though; the blackwell-data-explorer codebase could have dozens of notebooks for different user needs, but individual users would generally only have access to a subset of them. It also added quite bit of extra code to every notebook
I did write a quick script to generate the boilerplate needed for each notebook with npm run generate-notebook <notebook-name>, but the point of readability stands. , which felt a bit too much for what was supposed to be a lightweight front-end for visualising CSV data.
Getting around this meant that the parent web app, which had access to user configs, needed to tell the data explorer which notebooks were actually available. However, instead of passing that information through using the postMessage API, it was simply easy to kick that concern up the chain and let the parent web app itself handle navigation between notebooks. This felt more inline with the micro frontend approach by keeping the purpose of the micro frontend focused on notebook content, and only the notebook content.
Exporting Notebooks
Part of our vision for the data explorer was for it to facilate a first-pass on data, before users downloaded the raw CSVs for their own in-depth analysis. Our existing functionality for downloading data snapshots bundled all the CSVs into a single zip file for downloading Which is also what we send across the postMessage API. , but what if users wanted to build upon the notebooks themselves?
Some notebooks could be quite complex, and may even manipulate the datasets in helpful ways that the raw CSV export didn’t capture. If we did our job right, our users should find the notebooks themselves more useful than having just the raw data. Having a way to export the notebooks would help our users better integrate the tool into their existing workflows, and that was precisely what we did.
We updated our export feature to also include raw Observable Notebooks as part of the zip, with a few tweaks to make sure they would work right out of the box. Whenever the notebook microsite was deployed, it would also create a notebook-archive.zip file containing the notebooks themselves. When the web app initiates the data loading flow mentioned above, it would also receive this archive, and include it in the export zip file that users could download.
Most importantly, these exported notebooks were stripped of the data loading logic from before, and replaced with a simple FileAttachment block that would load the CSVs directly from the zip file. Instead of something like:
<script id="DATA_LOADER" type="module" hidden="">
  const { DataLoader } = await import(await FileAttachment("data-loader.js").url());
  const loader = new DataLoader();
  const data = await loader.loadData("treatments.csv");
</script>
We’d drop data-loader.js entirely, and replace it with the much simpler:
<script id="DATA_LOADER" type="module" hidden="">
  const data = await FileAttachment("treatments.csv").csv();
</script>
This meant when users downloaded the final archive, they could simply unzip the exported notebooks and open them in Observable Desktop with the data that was already there.
This gave us a neat little package that users could buld upon as they saw fit, which was a great solution for the research teams at King’s College London and the South London and Maudsley NHS Foundation Trust in the UK, with whom we partnered to design and build this tool to help better characterise patient engagement with their trials using Fora Health.
Observable Notebooks gave us a powerful and flexible way to build a data explorer that was both interactive and easy to maintain, and the micro frontend approach allowed us to integrate it into our existing web app without having to make any major changes to our codebase. It’s a great example of how new technologies can be leveraged to solve real problems in innovative ways, and we’re excited to see how this tool evolves as we continue to iterate on it with our users.